
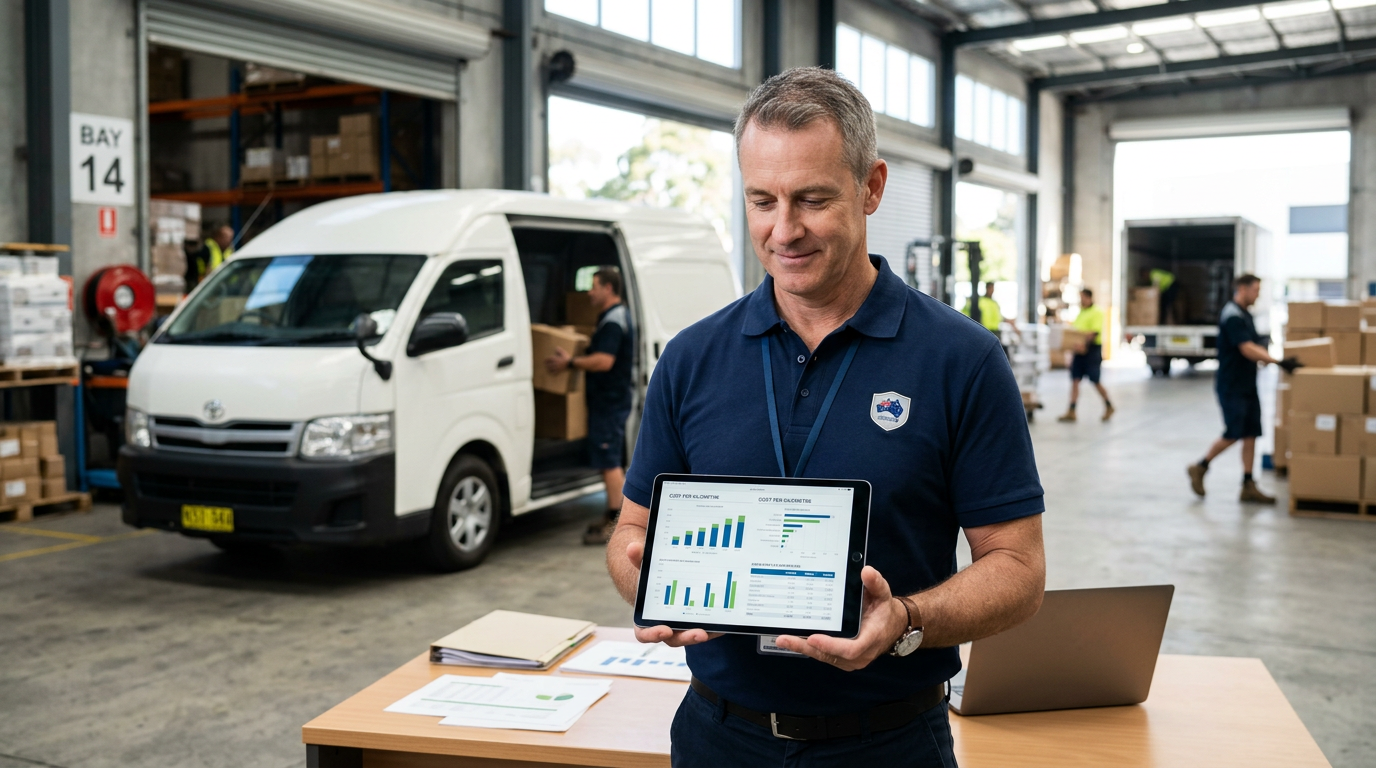

A Deep Dive into Your Fleet’s Cost Per Kilometre
Do you know your fleet's true cost per kilometre? Our guide shows you how to calculate it, revealing…
This ultimate guide shows you exactly how to calculate cost per kilometre for your fleet and provides actionable strategies to slash your operating costs.

We’ll never forget the client. He ran a brilliant automotive parts distribution business out of Dandenong, Victoria. Fantastic products, happy customers and growing sales. A true success story on paper.
But behind the scenes? His cash flow was a nightmare and he couldn’t figure out why. After digging into his operation we found the culprit. His delivery fleet was a black hole that was secretly burning through cash with costs he couldn’t see.
We are Ontime Delivery Solutions, a dedicated delivery service built for businesses that need reliable, professional logistics support. That story isn’t unique. We’ve seen it dozens of times. The number you see on the fuel receipt from BP or Ampol is just the tip of the iceberg. What’s hiding underneath is what sinks businesses. This guide isn’t just theory. It’s a fleet management cost analysis designed to help you master your vehicle costs whether you run your own fleets or use dedicated delivery services like ours. The goal is to get you back to what you do best which is kicking goals in your core business.
Here’s your quick roadmap to taking back control of your fleet expenses.
Let’s stop the guesswork and start driving your profitability forward.
There’s nothing worse than that feeling is there? You know a part of the business is bleeding money but you can’t prove exactly how or where. You feel the pressure and you see the problem. But you can’t build a clear case for change. This first step is about fixing that. It’s about giving you the undeniable data to back up your intuition so you can stop feeling stuck and start leading with confidence. You’ll be armed with the one number that changes everything for your vehicle fleet.
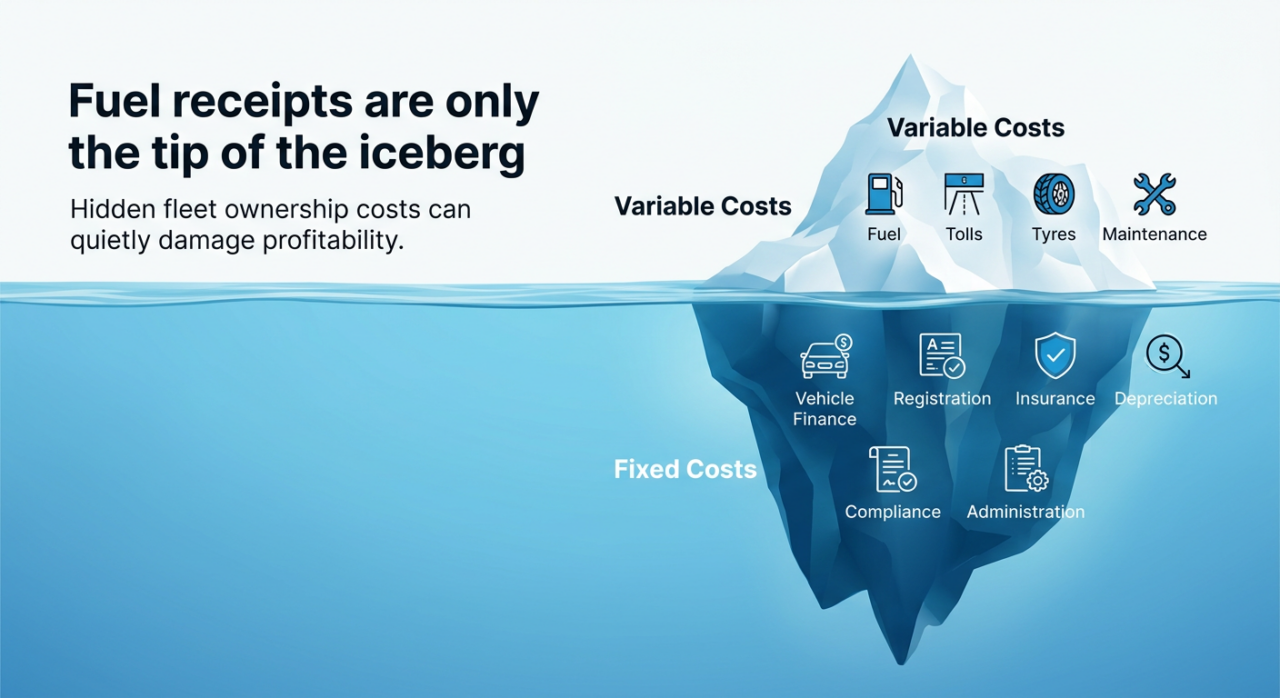
Think of your vehicle costs like an iceberg. The 10% you see above the water are your Variable Costs. Put simply these are your ‘pay-as-you-go’ expenses that change with activity. But it’s the 90% below the surface or the Fixed Costs that you pay just to own the fleet whether it moves or not that can rip a hole in the side of your business if you ignore them. These are the key cost components of your fleet.
Now we tie it all together with one master metric. The Cost Per Kilometre tells you exactly what it costs your business every time a vehicle travels one kilometre. Why does this number matter so much? Because without it you’re just guessing. You can’t price a delivery job accurately if you don’t know your true cost of service. If your Cost Per Kilometre is $1.80 and you take a job that pays $1.70 per kilometre it means you’re actively paying to lose money on every single run. Getting these calculations right is vital for any fleet managers.
Cost Per Kilometre = (Total Fixed Costs + Total Variable Costs) / Total Kilometres Travelled
Depreciation is simply the loss in your vehicle’s value over time. It’s the number one cost business owners miss in their fleet cost analysis. Here’s how to do the simple maths for your vehicle:
That is a real and annual fixed cost you absolutely must include in your calculations.
So you’ve completed your cost per kilometre calculations. But the number still feels too high, right? There’s a good reason for that. The biggest drains on your profit almost never show up on an invoice. These are the silent killers. Here’s the logic behind why these vehicle expenses are so damaging to your fleet.
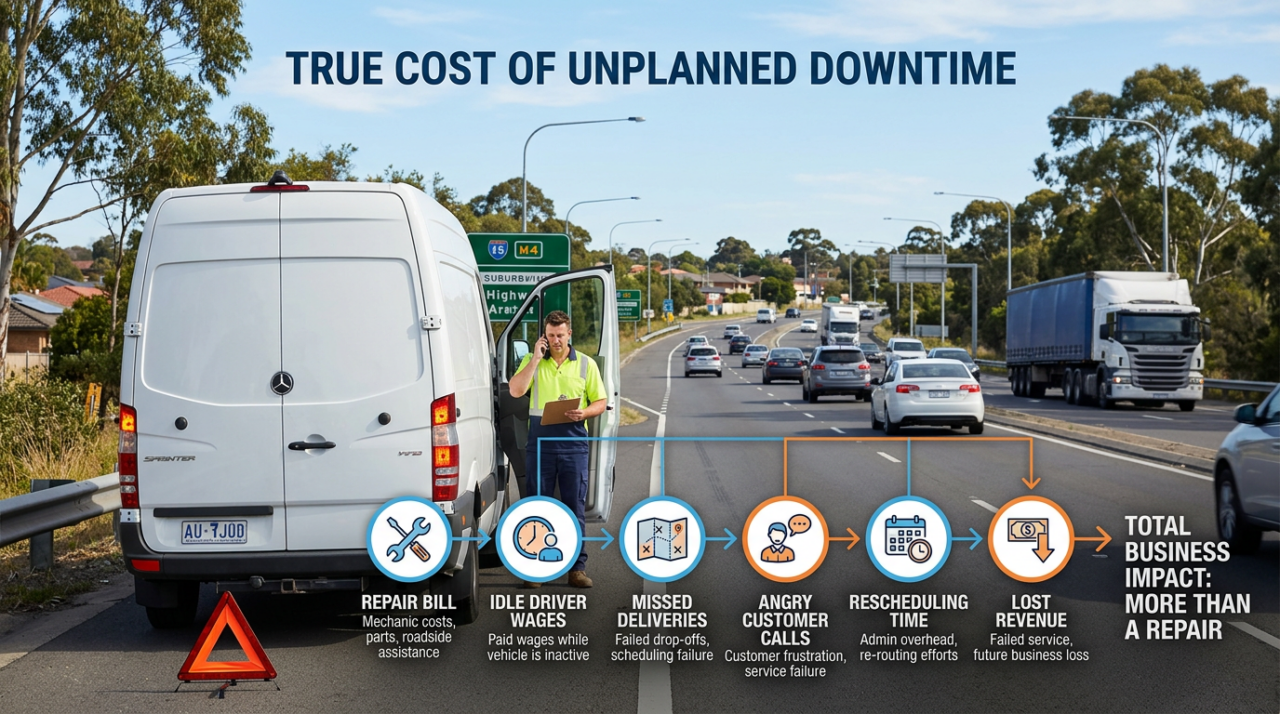
The Logic: When a vehicle stops it triggers a costly chain reaction. It’s not just the repair cost. The driver is now idle but still on the clock. The deliveries are late which damages customer trust. Your manager has to stop their work to reschedule everything. That’s your star driver sitting on the M1 during peak hour unable to complete a run worth $500. The true cost isn’t just the tow truck. It’s the lost revenue from downtime plus the frantic phone calls to an angry customer.
The Logic: Think of your fuel budget as a bucket of water. Every instance of harsh braking in Sydney traffic or a bad route choice in Melbourne is a small and silent leak that impacts your fuel usage. Let’s do the simple maths on just one driver’s vehicle.
Across a fleet of five vans that’s $2,600 a year straight from your bottom line just on easily preventable waste. It’s enough to make you weep.
The Logic: This is the classic definition of “opportunity cost.” Your time and your key people’s time are your most valuable assets. Every hour your best operations manager spends on the phone with a mechanic is an hour they can’t spend on high-value work like sales or product development or customer service. This misallocation of resources is one of the most expensive hidden costs in any business. Understanding your fleet’s total cost of ownership includes these indirect expenses.
You’ve seen the formulas. Now let our experts run a professional cost analysis to pinpoint your exact savings opportunities with a complimentary Fleet XRAY.
Get My Free Fleet XRAY Analysis
Or call us on 1300 778 919
This is the exciting part. Now that we’ve put a number on the problem we can start solving it. This is a toolkit of practical and proven strategies you can start using today to bring that cost per kilometre down and put money back into your business fleet. These are the maintenance costs and operating costs fleet managers need to watch.
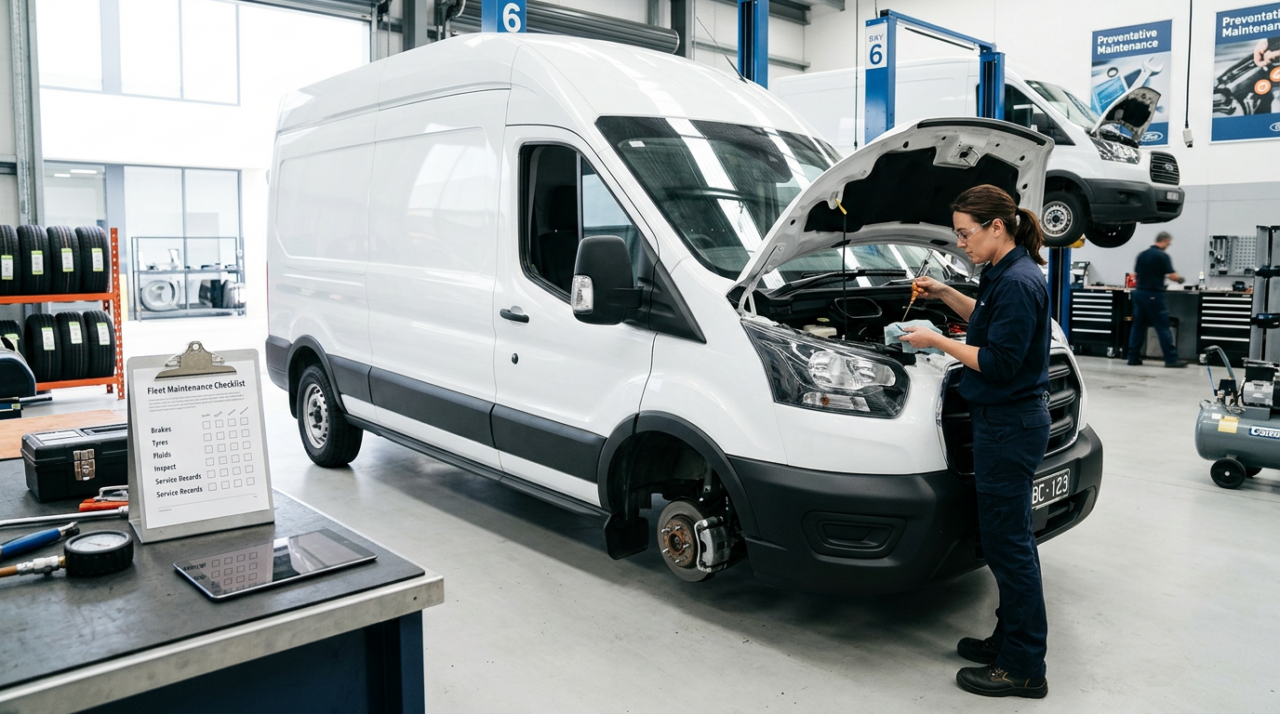
In the software world there’s a concept called “technical debt.” It’s what happens when you take a shortcut now that creates a massive and expensive problem you’ll be forced to fix later. Skipping a $150 oil change on your Ford Transit is a classic example of technical debt in logistics. It feels like you’re achieving savings but you’re just racking up a debt that you’ll pay back with interest when the engine blows and costs you thousands. Don’t do it. Smart fleet maintenance is key.
Our Recommendation: Implement this non-negotiable schedule for a standard 2-tonne van. It’s the blueprint we use for every vehicle in our fleet.
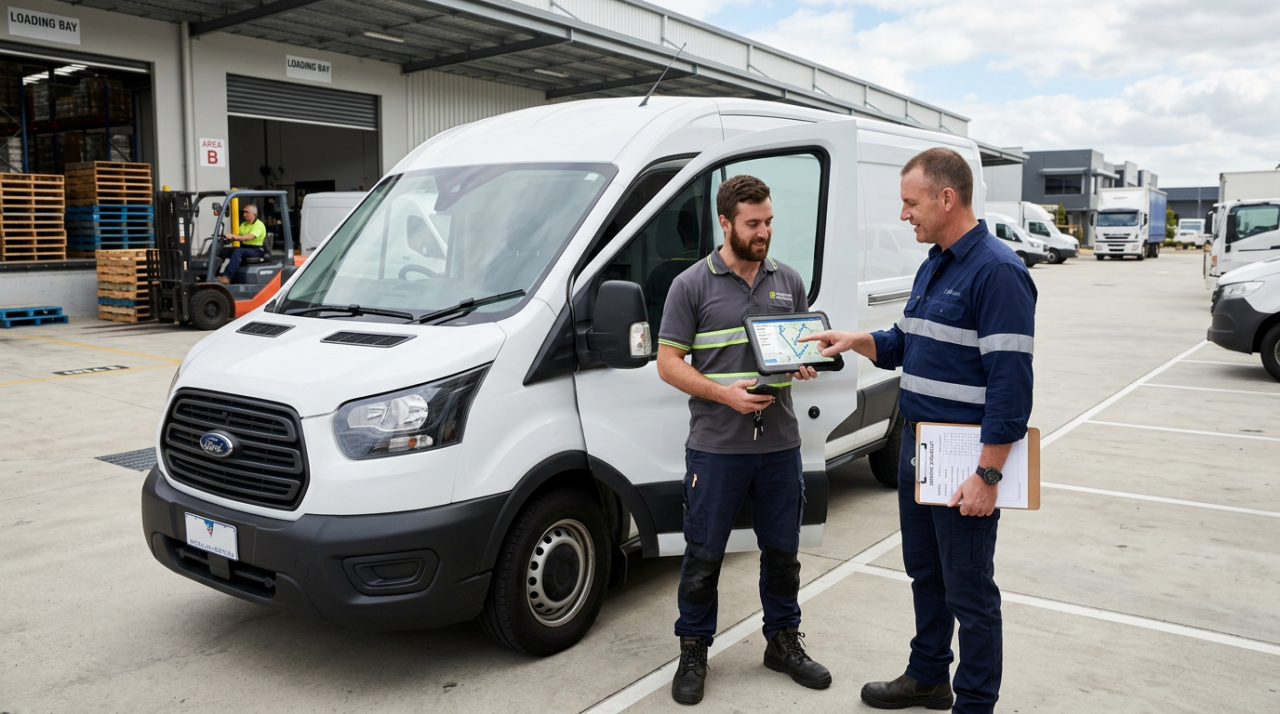
You don’t need expensive software to start with route optimisation. Take your most common daily run with 5 or more stops. Map it in Google Maps or Waze. Now you should manually re-order the stops. We guarantee you’ll find a more efficient path that saves you 15-20 minutes. Here’s what that small win is really worth for your vehicle.
That’s two full work weeks of productivity you just clawed back from a single route. Not a bad return for an afternoon’s work.
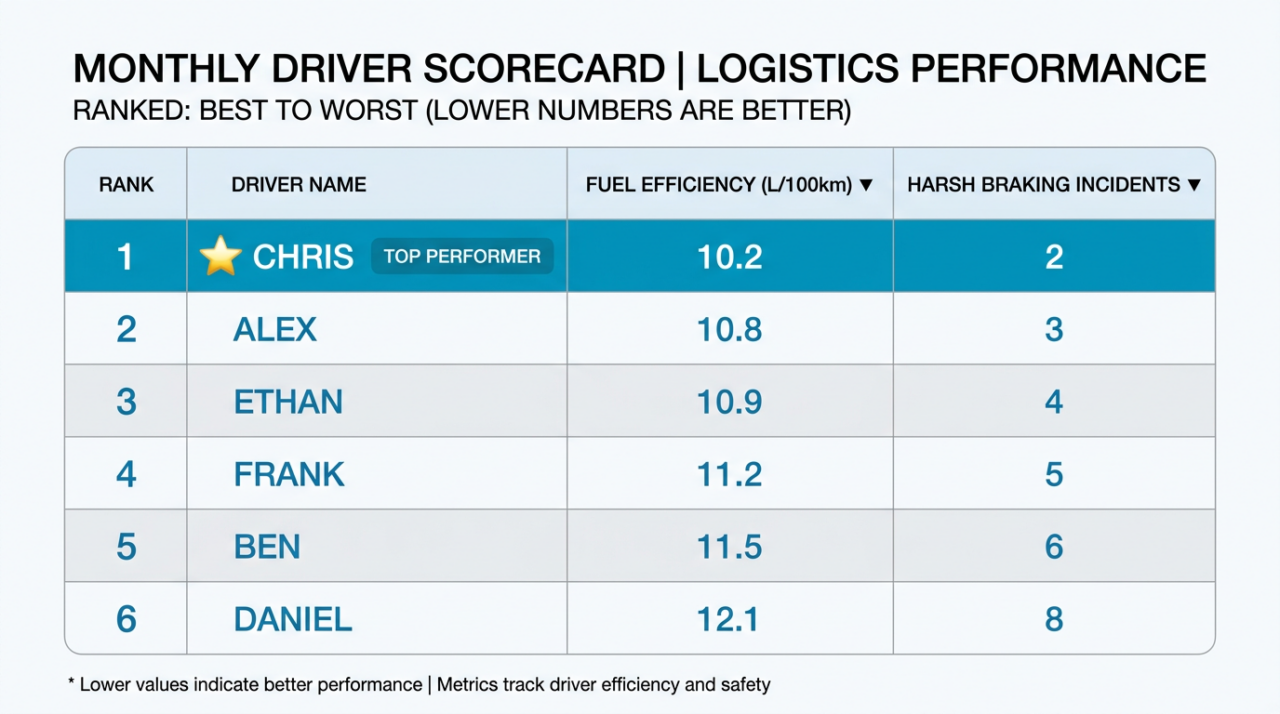
To foster a culture of efficiency you should make it a positive competition. Here’s what I’d do. Create a simple monthly scorecard for each driver based on two key metrics you can track. Fuel Efficiency (L/100km) to monitor fuel costs and Harsh Braking Incidents. Celebrate the winner. This turns cost-cutting into a team sport and not a punishment.
You now have a powerful toolkit to reduce your costs. But for many busy owners the real question becomes something more. Something bigger. You have two clear paths forward from here for your vehicle fleet.
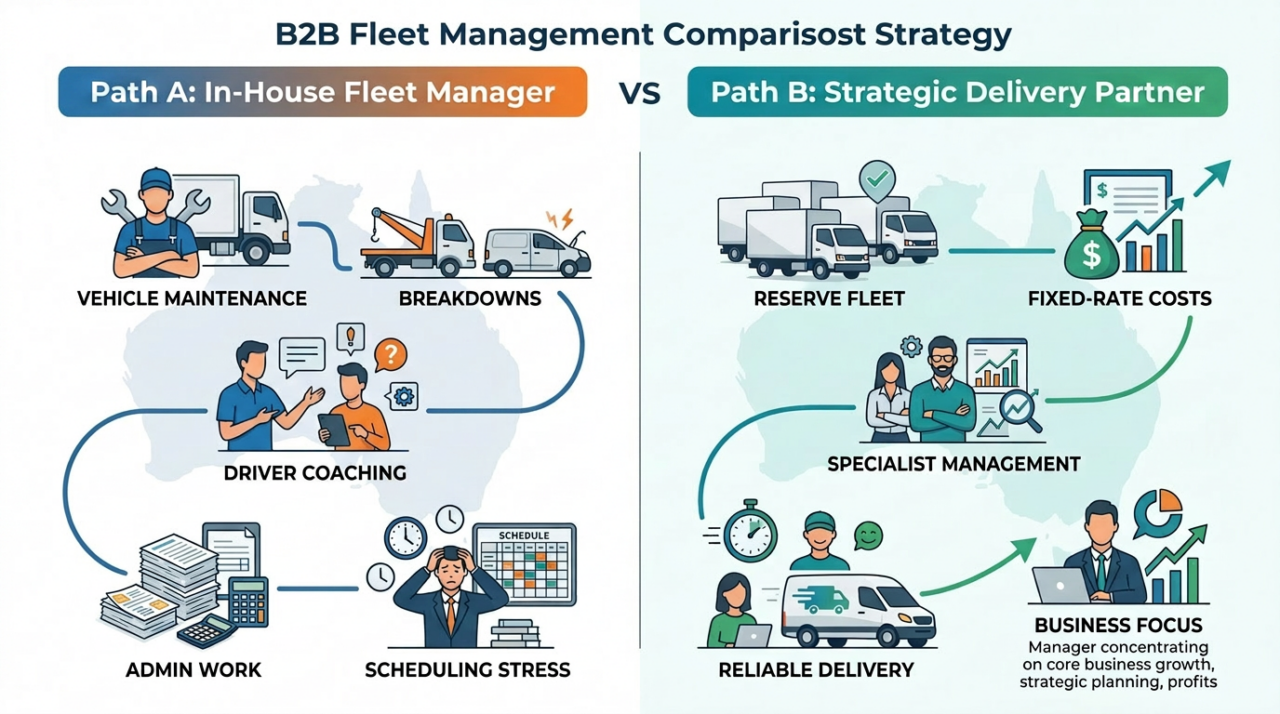
You take on the full responsibility. You run the fleet maintenance schedules. You analyse the data. You coach the drivers. You handle the breakdowns. It’s a viable path but it demands your time and focus which are two of your most valuable assets for vehicle ownership.
You hand the entire operational headache to a specialist. A dedicated partner replaces the gamble of in-house management with certainty. But how? It’s not magic. It’s about building operational “bulkheads” that contain risk for your fleet.
✅ Certainty Over Downtime
If your van’s engine fails your operation stops. Our mechanism is a reserve fleet. Our problem doesn’t become your crisis. That’s the bulkhead.
✅ Certainty Over Costs
If fuel costs jump 20% that volatility hits your bottom line. Our mechanism is a fixed-rate contract. We absorb that financial risk instead of you. That’s the bulkhead.
✅ Certainty Over Focus
Your team is juggling a dozen priorities. Our mechanism is specialist management. Our team has only one job and that’s running your logistics with maximum efficiency. That’s the bulkhead against chaos.
The result isn’t just cost savings. It’s peace of mind for your fleet.
You can keep managing the tip of the iceberg and hoping your business doesn’t hit anything or you can get a guide who knows how to navigate these waters safely. The choice is yours. Ultimately this isn’t just about saving money on your delivery fleet. It’s about reclaiming your focus. Controlling your cost per kilometre is the tool but the real prize is getting back to the work that only you can do. Growing your business. The cost of your time is the most important cost of all.
You’ve done the back-of-the-napkin maths. Now let us run the professional analysis for you. Our complimentary Fleet XRAY analysis is the expert version of this guide. It provides a detailed comparison of your in-house fleet costs versus our fully managed solution with detailed cost calculations for every vehicle.
This guide gave you the blueprint. Now get the exact numbers for your business. Our free Fleet XRAY analysis will show you your true Cost Per Kilometre and your specific savings opportunities.
Get My Free Fleet XRAY Analysis
Or call our team for a chat on 1300 778 919
While specific benchmarks range from $1.00 to $2.50 per kilometre for commercial vehicles the only number that truly matters is your own. The goal isn’t to hit an arbitrary industry average cost per mile but to establish your baseline cost per kilometre and then consistently work to improve your fleet costs month after month.
From our experience it’s viewing maintenance as a reactive cost instead of a proactive investment. They wait for a vehicle to break which always costs more in downtime and repairs than a simple and scheduled service would have.
You need to attack both types of expenses but with different tools. You control variable costs with operational discipline like driver coaching and smart routing. You control fixed costs with strategic decisions like choosing the right vehicle or eliminating vehicle ownership altogether through outsourcing. Your total fleet cost is a sum of both.
The most effective way to start reducing costs is with a two-step “quick win” approach. First you’ll use the fleet cost per kilometre formula (Total Costs / Total KMs) on your last 90 days of data to establish a clear baseline. Second, you’ll implement one high-impact operational change such as the Driver Scorecard Method to create immediate savings and build momentum. This approach delivers a measurable result quickly for your fleet.
An in-house fleet offers direct control but comes with full exposure to financial and operational risks. In contrast a dedicated delivery partner provides certainty by absorbing these risks. The key tradeoffs are below.
From pickup to drop-off, we make every step easier.
Need drivers? 1300 778 919